
Dynamic Rebound Index for interpreting drop jump performance
The Dynamic Rebound Index (DRI) combines rebound height, drop height and contact time into one score for drop jump testing. Its creator, Lance Brooks, PhD, explains what it measures, how it differs from RSI, and how to apply it in practice.
Published September 28, 2026 · 9 min read

Introducing the Dynamic Rebound Index
The Dynamic Rebound Index (DRI) is a score designed to help coaches understand an athlete’s performance during a drop jump. In this test, the athlete steps off a raised box, lands, and immediately jumps upward. The aim is to jump high while spending as little time as possible on the ground. I developed DRI to bring together three pieces of information: the height of the rebound, the time spent on the ground, and the height of the preceding drop. [1]
For coaches, DRI provides an additional way to describe rebound performance and follow changes across repeated tests. When drop height and testing procedures remain consistent, a higher score can result from jumping higher, leaving the ground sooner, or both. For example, an athlete who achieves the same jump height with a shorter ground contact will produce a higher DRI.
Including drop height also helps place the result in context: rebounding after a greater fall involves a different demand. To understand what a score means, coaches should therefore consider DRI alongside the individual measurements and the conditions of the test. This makes it easier to explain how the athlete’s performance has changed.
The mechanical context of a rebound
Drop jumping involves braking the body’s downward motion and generating an upward takeoff during one ground contact. The Reactive Strength Index (RSI), calculated here as jump height divided by contact time, provides a familiar way to describe the resulting performance. Contact duration also helps practitioners judge whether the task matches their intended stretch–shortening cycle (SSC) demands. [2]
The preceding fall matters because it changes the task before the athlete begins to rebound. In a biomechanical study, Bobbert and colleagues found that increasing drop height altered joint reaction forces without a corresponding increase in push-off output across all conditions. [3] An index that includes drop height can therefore add context, provided that the height term is defined consistently.
Defining DRI
DRI combines rebound height with the equivalent drop height and divides their sum by gravitational acceleration multiplied by squared contact time. [1]
DRI = (h + h_drop) / (g × t_c²) RSI = h / t_cHere, h is the vertical rise of the center of mass from takeoff to the apex, h_drop is equivalent drop height, and t_c is ground contact time. Heights are in meters and time in seconds. Gravitational acceleration g is approximately 9.81 m·s⁻². Both the numerator and denominator of DRI have dimensions of length, making DRI dimensionless; this height-based RSI has units of m·s⁻¹. [1,2]
The equivalent drop height is the squared vertical touchdown speed divided by twice gravitational acceleration. [1] This expresses the incoming velocity as a height. The resulting index summarizes the rebound task; it does not directly measure tendon energy return, joint stiffness, or the distribution of force within contact. Those quantities require additional measurements.
How the inputs change the score
The examples below use deliberately chosen mathematical inputs rather than measurements from athletes. They show how DRI responds to changes that a single RSI value can conceal. Equivalent drop height is the input to the equation and should not automatically be equated with nominal box height.
| Trial | Drop height (m) | Jump height (m) | Contact time (s) | RSI (m·s⁻¹) | DRI |
|---|---|---|---|---|---|
| A | 0.20 | 0.40 | 0.20 | 2.00 | 1.53 |
| B | 0.40 | 0.40 | 0.20 | 2.00 | 2.04 |
| C | 0.40 | 0.30 | 0.15 | 2.00 | 3.17 |
Table 1. Illustrative calculations using g = 9.81 m·s⁻² and the definitions in references 1 and 2.
Trials A and B differ only in drop height. DRI increases by one third while RSI remains unchanged. This increase reflects the higher input demand included in the calculation. It cannot, by itself, be described as a one-third improvement in the athlete’s underlying capacity because the athlete performed a different task.
From B to C, both jump height and contact time fall by 25%. RSI again remains constant, whereas DRI rises from 2.04 to 3.17. Whether C represents the preferred performance depends on the intended balance between rebound height and rapid ground contact. The calculation makes that trade-off visible, but it cannot decide the training objective.
Sensitivity to contact time
The inverse-square contact-time term gives DRI a different response to timing changes. With both heights held constant, reducing contact time by 10% increases DRI by approximately 23.5%; RSI increases by 11.1%. These percentages follow directly from the equations. Shorter contact can therefore raise DRI substantially even when rebound height does not improve.
The same sensitivity applies to measurement error. As an illustrative calculation, recording a true 0.200 s contact as 0.195 s overestimates DRI by approximately 5.2%, assuming the height inputs are unchanged. This is a mathematical example, not an estimate of any device’s accuracy. Consistent identification of touchdown and takeoff is essential when interpreting small changes.
Making comparisons interpretable
I would distinguish monitoring from profiling. Monitoring asks whether an athlete’s performance changes under a repeated set of conditions. Profiling deliberately varies the demand, for example by testing several drop heights. A profile should show each height separately, together with jump height and contact time. Averaging scores across different drop heights obscures which task produced the result.
For monitoring, calculate DRI for every valid trial before calculating a session mean. Because the equation is nonlinear, DRI calculated from the mean inputs need not equal the mean of the individual DRI values. Predefine the aggregation rule and retain it throughout the monitoring period.
What the available evidence supports
My original paper used modeled combinations of height and contact time to examine the index’s behavior. [1] This establishes mathematical properties; predictive validity and responsiveness to training require separate empirical evaluation.
Balsalobre-Fernández subsequently compared My Jump Lab with a force platform in 17 physically active participants. Each completed six drop jumps from a 40 cm box in two sessions separated by 48 hours. Across 204 paired jumps, DRI showed Pearson r = 0.979 and a concordance correlation coefficient of 0.978. The app-minus-platform bias was −0.026, with limits of agreement from −0.211 to 0.159. [4]
| Device | Between-session ICC (95% CI) | Between-session CV |
|---|---|---|
| Force platform | 0.901 (0.677–0.970) | 12.8% |
| My Jump Lab | 0.847 (0.499–0.953) | 16.1% |
Table 2. Reported DRI test–retest results based on six-trial session means. ICC model reported as ICC(3,k). Adapted from reference 4, Table 3.
The platform used a velocity-derived drop-height estimate; the app used nominal box height. The comparison therefore includes differences in calculation inputs. The author also disclosed being the app’s developer. [4]
These results support measurement feasibility under the tested protocol. They do not establish that DRI predicts sprinting or sport performance better than RSI, or that either device can reliably detect a small training effect.
Reliability and individual change
A high correlation describes how measurements vary together. Agreement additionally concerns whether their numerical values are sufficiently close for the intended use. Within-athlete error addresses a further question: how much can a repeated score fluctuate when the athlete’s underlying state is broadly stable? These questions should be evaluated separately. [5,6]
The intraclass correlation coefficient (ICC) depends partly on differences between participants, as well as the selected statistical model. It should be reported with its confidence interval and with the measurement type specified, including whether the result concerns one trial or an average. A coefficient of variation (CV) expresses relative variability and helps place changes in the context of measurement noise. [5,6]
Consequently, a high ICC can coexist with enough variability to make a small individual change difficult to interpret. For monitoring, I would estimate typical error using familiarized athletes, repeated baseline sessions and the same scoring procedure intended for routine use. A published CV should not automatically become a universal cutoff for improvement. Decisions need to consider both the uncertainty in the change and its practical importance. [5]
Applying DRI in practice
A useful protocol begins with a clear test purpose. Keep the warm-up, instructions, arm position, surface and footwear consistent, and predefine acceptable trials. Contact-time targets should reflect the intended task rather than being changed to obtain a higher score. The established RSI literature supports interpreting contact time alongside jump performance when designing SSC assessments. [2]
Specify how drop height is obtained. Nominal box height and a velocity-derived equivalent height are different inputs. If box height is used as a field approximation, document that choice and standardize how the athlete leaves the box. Changing this convention, or the method used to estimate rebound height, changes the calculation and can disrupt a longitudinal comparison. [1,4]
In the report, retain DRI alongside RSI, rebound height, contact time and the drop-height input. An increase in DRI should prompt inspection of those components. For example, a shorter contact accompanied by a lower rebound may support a different interpretation from a higher rebound at an unchanged contact time. The raw variables allow that distinction to remain visible.
I see DRI as a way to add mechanical context to rebound assessment. Its practical contribution will depend on whether that context improves decisions beyond the measurements already available. For now, the most defensible approach is a clearly specified protocol, transparent reporting of the inputs, and interpretation grounded in the athlete’s repeated performance.
About the author: Lance Brooks, PhD, is a biomechanist and the creator of the Dynamic Rebound Index. He is the founder of Brooks Performance Methods and teaches at Bridgewater State University. Connect with him on LinkedIn.
References
- Brooks LC. A unified mechanical framework for evaluating stretch–shortening cycle function. European Journal of Sport Sciences. 2026;5(1):1–10. Publisher article
- Flanagan EP, Comyns TM. The use of contact time and the reactive strength index to optimize fast stretch-shortening cycle training. Strength and Conditioning Journal. 2008;30(5):32–38. doi:10.1519/SSC.0b013e318187e25b
- Bobbert MF, Huijing PA, van Ingen Schenau GJ. Drop jumping. II. The influence of dropping height on the biomechanics of drop jumping. Medicine and Science in Sports and Exercise. 1987;19(4):339–346. PubMed 3657482
- Balsalobre-Fernández C. Smartphone-based assessment of the stretch–shortening cycle: Validity and reliability of the My Jump Lab app for measuring the Dynamic Rebound Index. Sensors. 2026;26(10):3068. doi:10.3390/s26103068
- Hopkins WG. Measures of reliability in sports medicine and science. Sports Medicine. 2000;30(1):1–15. doi:10.2165/00007256-200030010-00001
- Koo TK, Li MY. A guideline of selecting and reporting intraclass correlation coefficients for reliability research. Journal of Chiropractic Medicine. 2016;15(2):155–163. doi:10.1016/j.jcm.2016.02.012
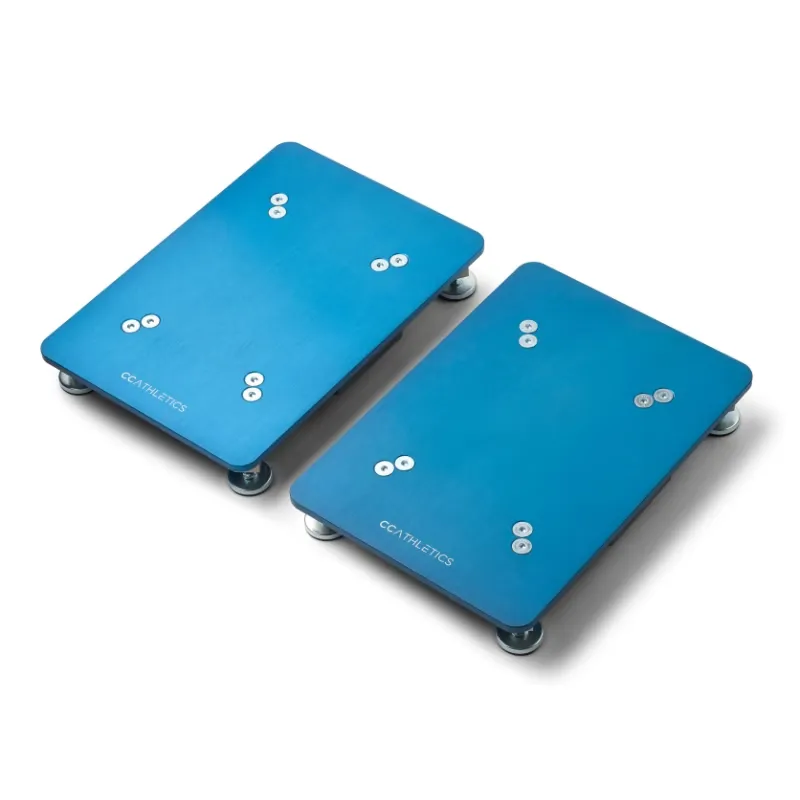
The product behind this article
PlateMate
Dual Force Plates
Explore PlateMate →